Statistics
Overview
In this section, you can see how the resources are currently being used:
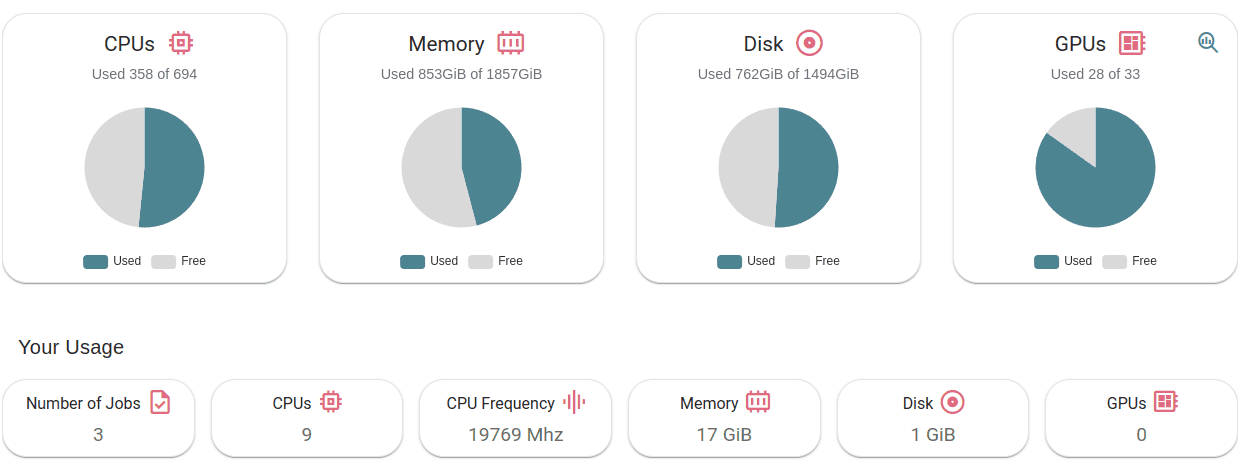
In
Cluster Usage Overviewyou will see how many resources are currently consumed/available in the platform.In
Your Usageyou will see how many resources you are currently consuming.
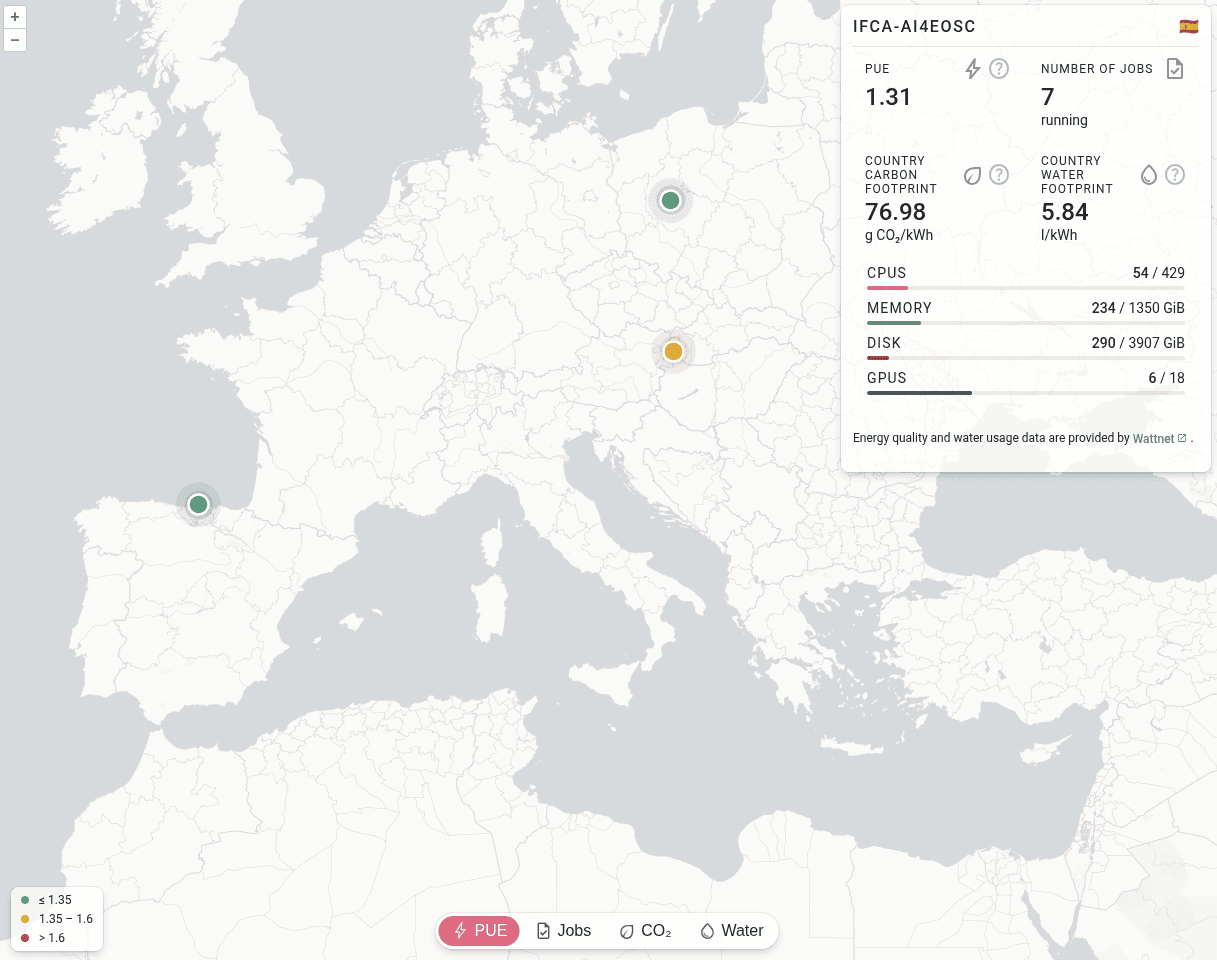
Datacenters
In this section you will see a map of the datacenters that are providing resources for the platform, along with their metrics:
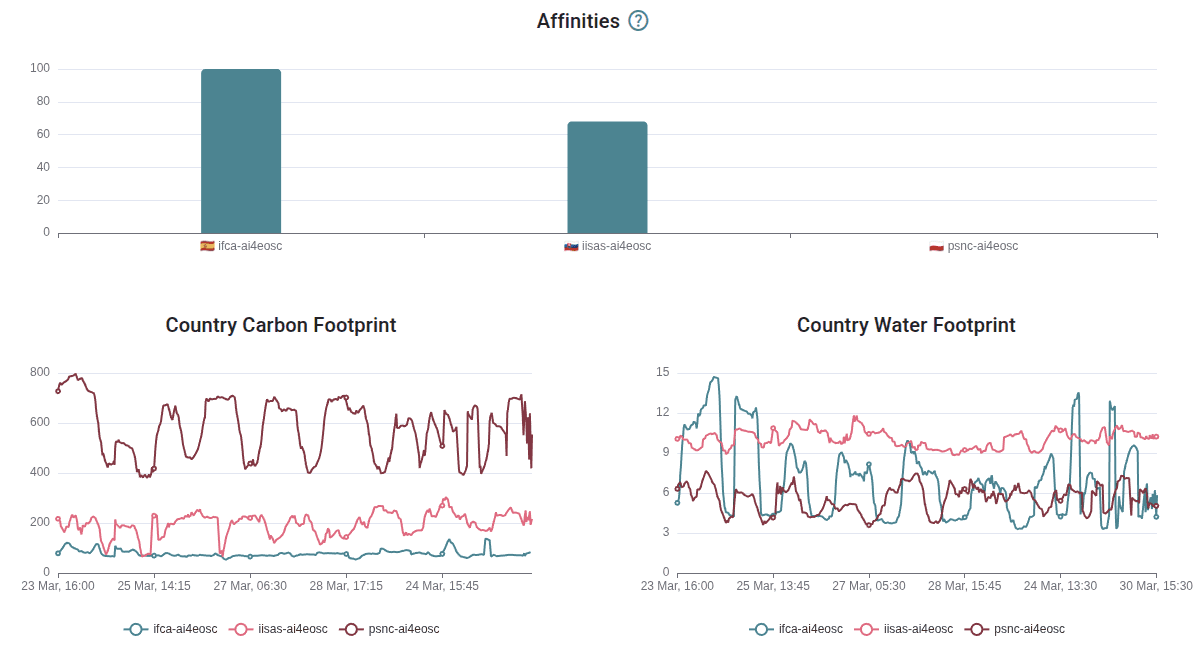
Footprint
In this section, you will see all the relevant metrics regarding the carbon and water footprint of the AI4EOSC datacenters, including the dynamic datacenter ranking created by our GreenDirector that favour routing jobs to greener datacenters:
Usage
In this section you can see the historical usage metrics of the platform.
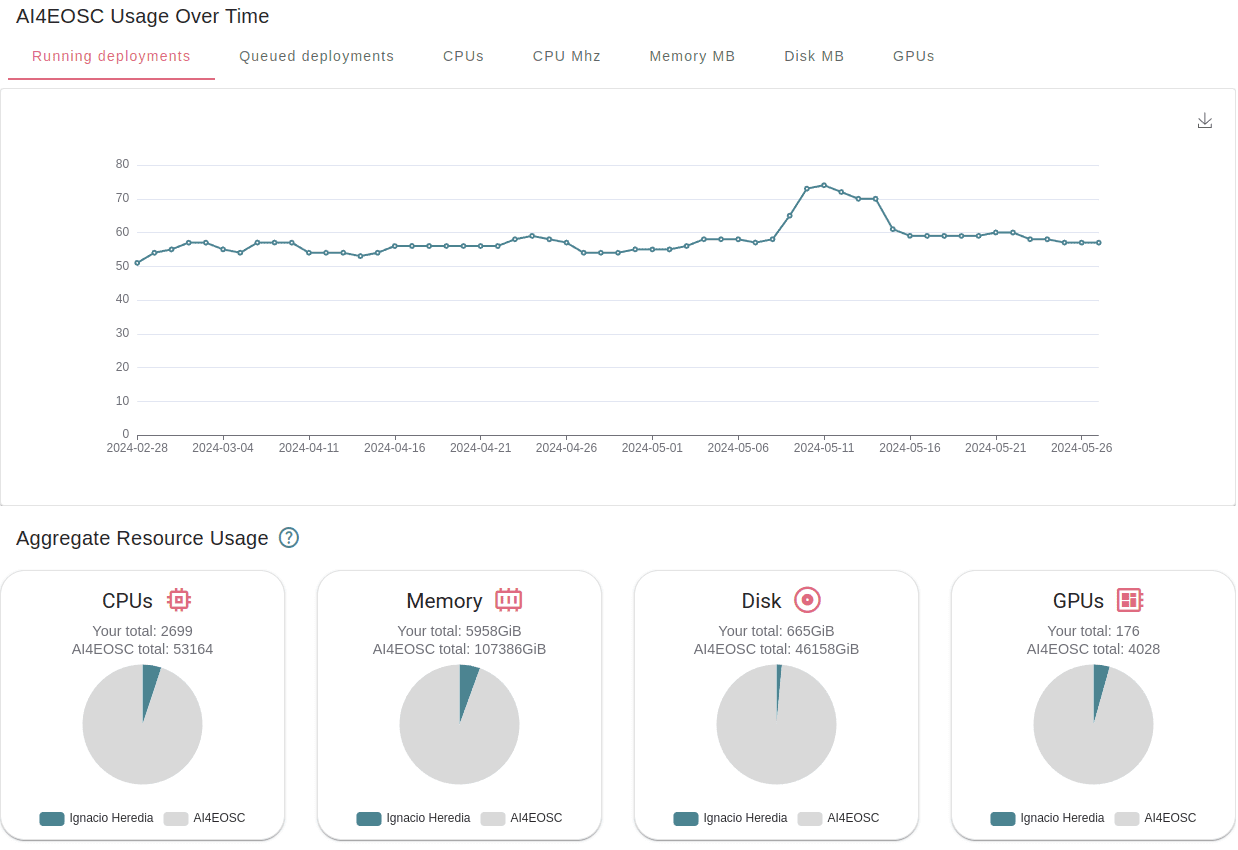
In
Usage over timeyou can see the daily usage time-series over the last 3 months. In addition to the standard resources, we show how many jobs where running and were queued at each point in time.In
Aggregate Resource Usageyou will be able to see to total use of resources, aggregated over the lifetime of the project. We show both the whole project aggregate use, as well as your particular use.The metrics units are
<resource> / day. Therefore 2000 CPU consumed means that you have consumed the equivalent of 1 CPU for 2000 days (eg. same as 2 CPU for 1000 days).As the resources in the project are assigned for exclusive usage, the metrics are not measuring real usage, but allocated usage. So if you create a 1-CPU deployment for 10 days, the aggregate usage will show 10 CPU days, even if you did not actually use the CPU at all.